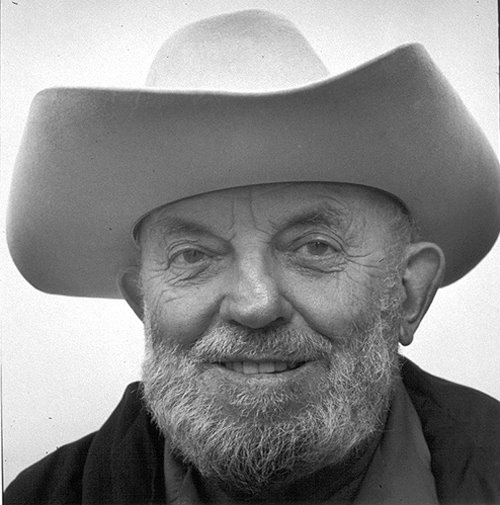
Adams- Visualization
The Key to a Photograph from Ansel Adams from SilberStudios.Tv on Vimeo.
Thanks SP!
Labels: Adams, Ansel, Visualization
posted by Ted Dillard at
8:40 AM
0 Comments
Links to this post
![]()
![]()
SUPPORT FOR THE DIGITAL PHOTOGRAPHER
the contents of this site ©TED DILLARD 2008/2009 / ALL RIGHTS RESERVED
Labels: Adams, Ansel, Visualization
posted by Ted Dillard at
8:40 AM
0 Comments
Links to this post
![]()
![]()
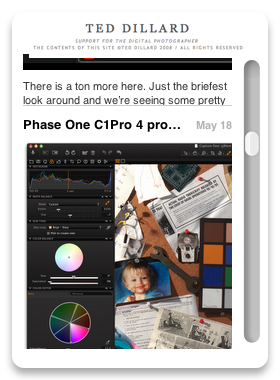
 ...just found this:
Labels: Adams, Ansel, electronic image
posted by Ted Dillard at
8:01 PM
0 Comments
Links to this post
![]()
![]()
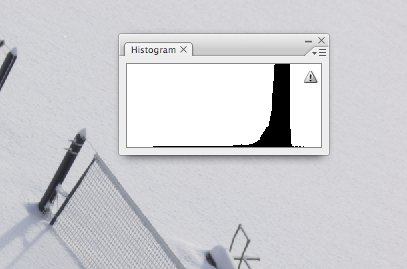
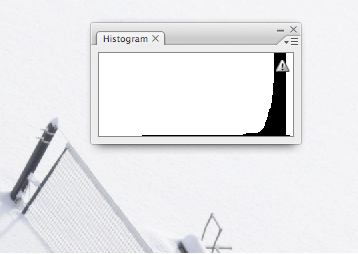
Labels: Adams, Ansel, EV compensation, Geekzone, histogram, levels
posted by Ted Dillard at
7:43 AM
1 Comments
Links to this post
![]()
![]()
Labels: Adams, Ansel, electronic, image, RAW
posted by Ted Dillard at
3:21 PM
0 Comments
Links to this post
![]()
![]()
Visit me at Head-2-Head Reviews!

Welcome!
This site is here for you… to use for reference, for learning new techniques, reminders of things you’ve learned before, and understanding the revolution of digital photography.
To find stuff:
Start by using the Google Search above- click the "www.teddillard.com" button to search here only.
The archives are listed below, if you just want to browse.
I've tried to label the posts consistently, so you can click on the "Label" tag under each post for all the posts that have that subject...
Thanks for stopping in… please feel free to leave comments, questions and suggestions, and you can always contact me via email here.
-Ted Dillard
March, 2008


Subscribe to
Posts [Atom]