My students hear it all the time. The single most powerful tool of digital imaging is the histogram, whether on the camera, or in “Levels” in Photoshop.
A histogram is a graph of the tonal values in an image. Simply put, the histogram on the camera lets me see the actual tonal values of the photograph, as I’m taking the picture. The histogram in Levels lets me see exactly where tones fall, and with a little experience, how they will print. The trick is learning how to understand the histogram, and how to use it.
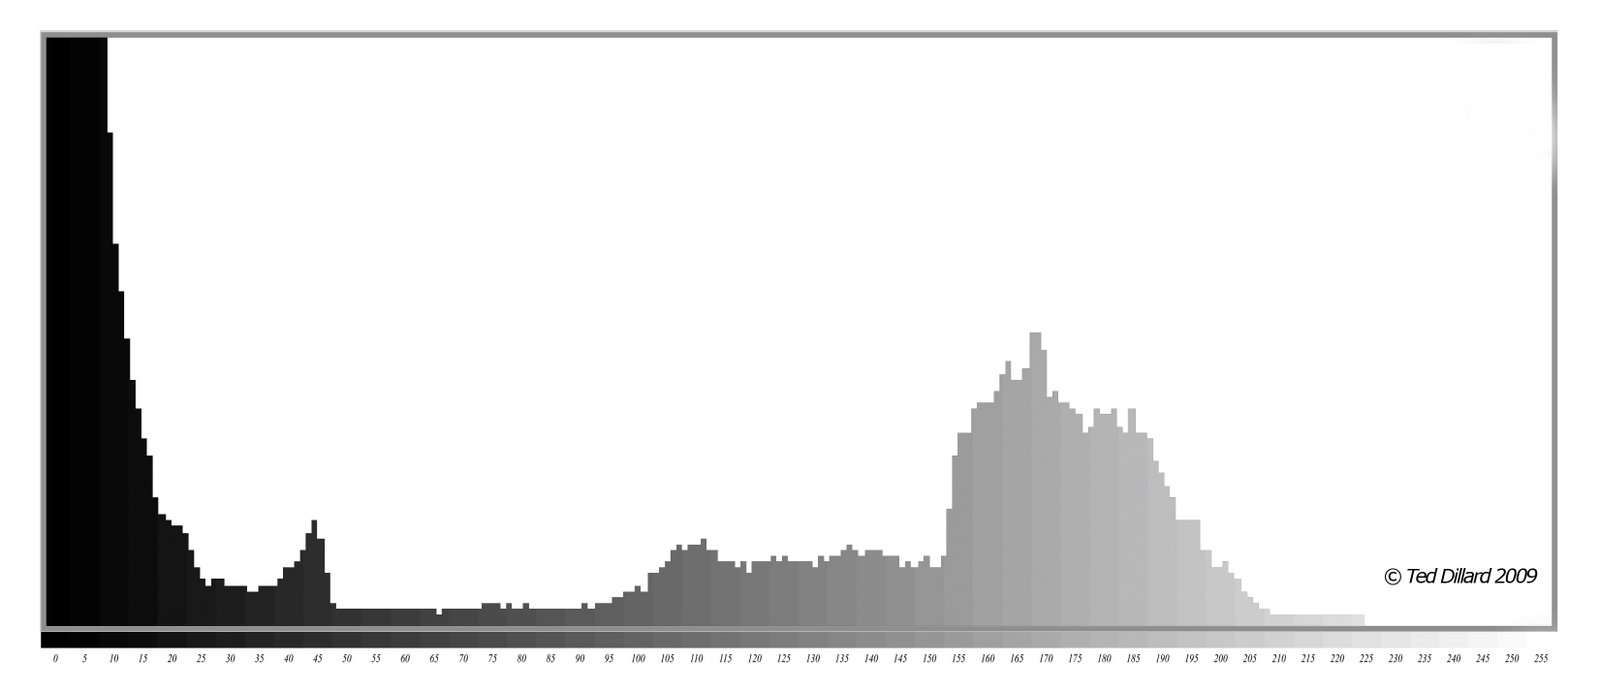
Let’s look at an image that is low contrast, and look at the histogram we get. The tones in the image range from medium-dark gray to medium light gray, and the histogram shows that very clearly. None of my tones map out to the extremes of the “graph”. Nothing hits the far-left, pure black, and nothing hits the white at the far right. My camera meter tries to average everything out, what my Dad used to call trying to “see everything as gray”. It will measure the entire scene and place the range of values, from light to dark, smack in the middle, giving me this histogram that sits right in the center of the graph.

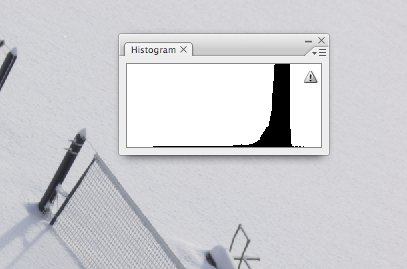
I can shoot a black dog and my camera will try to make her gray. A snowy field? Gray. Here’s a great example. Look at the thin lines to the left and right of the main black area of the graph. They are perfectly centered between the pure black and pure white extremes.
This, if you let it, will print just as you see it. Gray. You can adjust it in Photoshop, of course, but the better thing to do is to capture it where you want it, mapping the whites to the white values, the grays to the gray values, and that is the question… how do you tell the camera where you want to put these tones?
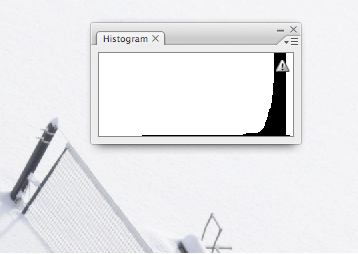
The answer is with the EV +/- control. Let’s assume you want to shoot with Auto Exposure, either in Shutter or Aperture Priority. The EV control lets you tell the camera to over- or under-expose the image, or simply put, make it brighter or darker. Going to the “+” side makes my snowy scene brighter, it pushes my tones up on the histogram and makes the gray values more white. A little practice will show you how much to boost it, but the histogram on the camera will show you precisely what the effect of the boost will be.
Here’s what it looks like when I boost the exposure “+1”. Immediately you can see the white snow reads, and even prints here as white, but more importantly, I can see on my histogram exactly how white that is. It’s just a small amount away from the pure white of the far right of my graph, indicating that it still has tones… the file is not “blown out”, or reading no detail in the highlights.

Watching the histogram on the camera, and judicious use of the EV +/- control, along with my vision of the final photograph allows me to capture the information I need, in the places I want it, to get the most information from my capture and ultimately make the highest quality photograph.
I remember seeing a great film about Ansel Adams, and there was this scene where he took a print out of the wash and popped it into the microwave (then, a very new contraption, often called the “Radar Range”). By drying it down, he could then read the blacks and whites in the print (with a meter) to make sure he’s getting the purest white and deepest black out of his paper and his negative. This is exactly what the histogram gives us.
Imagine if Ansel had that information at his fingertips as he was making his exposures! Crazy stuff!
Labels: Adams, Ansel, EV compensation, Geekzone, histogram, levels